
Decoding Trend Reversals: A Guide to Timeframe Analysis
- Gautam Mazumdar
- Aug 22, 2025
- 3 min read

If you want to go deeper, my book “Decoding Charts” covers this in detail
How to Recognize Trend Reversals Across Timeframes
Trading is often less about predicting the next tick and more about placing yourself on the right side of the bigger move. One of the most powerful concepts for any trader to grasp is timeframe analysis—understanding how short-term swings relate to the intermediate and long-term trend. Within this framework, recognizing reversals in the intermediate-term timeframe becomes the crux of successful swing trading and options strategies.
Why Timeframes Matter
Markets move in layers. What looks like a bullish rally on a 15-minute chart may simply be a pullback within a broader downtrend on the daily. Traders who fail to align their trades with the dominant trend of the relevant timeframe often get shaken out at the worst possible moments.
The intermediate-term trend (often measured in daily charts spanning weeks to a few months) acts as the bridge between the big picture and the short-term opportunities. Identifying when this timeframe is about to reverse provides a roadmap for positioning in short-term trades with far greater confidence.
The Crux: Recognizing Reversals in the Intermediate Term
Catching a reversal is never about hindsight alone; it’s about interpreting market signals as they unfold. Several reliable methods can be deployed to spot potential shifts in the intermediate timeframe:
1. Breakout Gaps (Bullish and Bearish)
A gap that occurs after a consolidation or base pattern often signals the start of a new intermediate-term trend. A bullish breakout gap usually accompanies strong volume and follow-through, while a bearish gap down after distribution warns of an impending decline. These gaps often leave little doubt about the market’s intent.
2. Breakout or Breakdown Failures
Sometimes, what looks like a breakout quickly reverses. This “failure” is one of the strongest reversal signals because it traps traders on the wrong side. When prices push beyond resistance but fall back into the prior range, it suggests the uptrend is exhausted. Likewise, a breakdown that doesn’t sustain often sparks sharp rallies. Recognizing these failures early gives traders an edge.
3. Support and Resistance Shifts
Intermediate-term reversals often coincide with the market flipping key levels. A support level that breaks convincingly and then rejects any pullback attempt is more than a short-term move—it is a structural shift. Likewise, resistance turning into support after a breakout is the essence of trend change.
Putting It All Together
Reversals are not identified by one signal alone. The best traders combine multiple factors:
A breakout gap with strong volume.
A failed breakout trapping longs.
Confirmation from support/resistance flips.
Together, these methods allow you to anticipate reversals before they become obvious to the crowd.
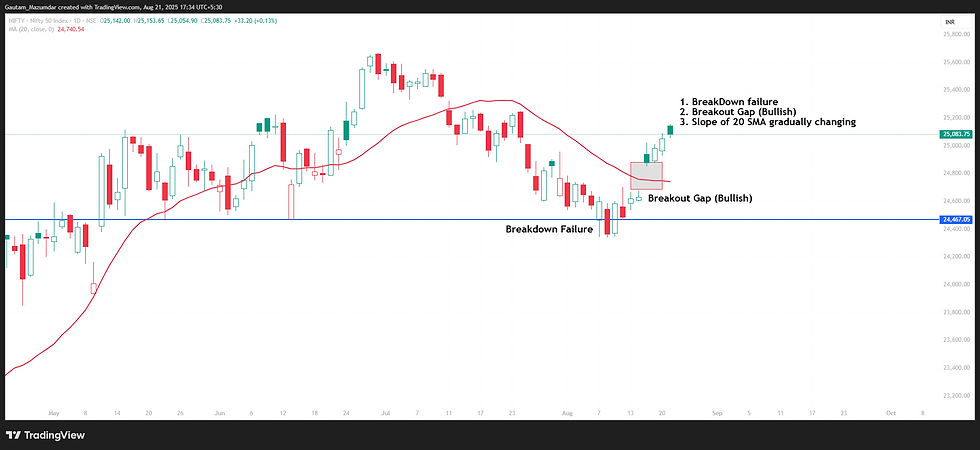
Daily chart of Nifty: A breakdown failure was quickly followed by a bullish breakout gap, while the 20-day SMA slope gradually turning. This confluence of signals marks a classic intermediate-term reversal setup, offering a high-probability backdrop for swing trades and bullish option strategies.
Why This Matters for Swing and Options Traders
Swing traders thrive on catching moves that last days to weeks. Options traders, especially those trading directional calls and puts, rely on timing. In both cases, spotting a reversal in the intermediate timeframe is the difference between luck and structure. It provides the conviction to hold a position rather than exiting too early—or worse, trading against the dominant trend.
Table 4.1: Timeframe Alignment (Adapted from my book Decoding Charts)
Intermediate-Term Trend | Short-Term Price Action | Typical Duration | Trading Implication |
Uptrend | Short-term upswings are stronger and more frequent | 4–8 days | Buy the dips; align with trend |
Pullbacks are shallow and short-lived | 2–4 days | Opportunity to add or re-enter | |
Downtrend | Short-term rallies are weak and brief | 1–3 days | Avoid long trades; watch for exhaustion |
Declines are stronger and longer | 5–10 days | Momentum favours short trades | |
Range-bound / Sideways | Frequent whipsaws and fake outs | 1–5 days | Use caution; avoid trend-based strategies |
No clear bias | Varies | Wait for breakout or breakdown |
The table above distils how short-term and intermediate trends often interact — not as fixed laws, but as recurring rhythms in market behaviour. Think of it less as a rulebook and more as a set of navigational cues. These tendencies can guide your interpretation, but they will not always unfold in neat symmetry. The market, after all, respects probability — not perfection.
Final Thoughts
Recognizing intermediate-term reversals is less about prediction and more about disciplined observation. Breakout gaps, failures, and structural shifts offer clear signals if you are willing to pay attention. For traders looking to sharpen their swing and options trading, mastering this skill is non-negotiable.
👉 Want to go deeper? This post is adapted from my book Decoding Charts. Buy your E-book and get access to detailed methods, examples, and strategies.


Comments